15
Aug 2023
Amazon PPC Case Study – Prime Day 2023
Prime Day is one of the most significant events for Amazon shoppers, sellers, and advertisers alike. It’s a 2 day deals event for Amazon Prime members, usually occurring in the second week of July, this day offers exclusive deals and discounts from brands on Amazon. In 2023, Prime Day was on July 11-12, and was one of the most successful days for Amazon.
While we were looking at the data of Prime Day ads managed by Mantaq Media for this case study, Amazon also shared some interesting numbers which are worthy of a mention here:
 The first day of Prime Day in 2023 had the most sales ever in one day on Amazon.
- The total Prime Day sales surged to a remarkable $12.90 billion, that’s 6.7% more than last year (2022).
- During the two-day event, more than 375 million items were sold.
- Prime members saved over $2.5 billion, which is another record.
These numbers show how big and important Prime Day is for Amazon.
Now, let’s talk about what we found in the Prime Day Amazon PPC advertising analysis from our accounts. But before I get into the interesting stuff we discovered, I’d like to give you an idea of how much data we looked at, so you know how thorough our study was.

Prime Day 2023 – PPC Performance
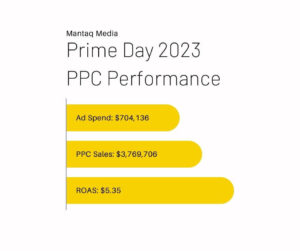
Here’s how our Amazon PPC ads performed on Prime Day 2023:
- We spent $704,136 on ads.
- Our sales reached 3,769,706 dollars.
- ACOS, which shows how efficient our ads were, was 18.68%.
- We earned $5.35 for every dollar spent (ROAS).
- Our ads appeared a whopping 284,666,609 times (impressions).
- People clicked on our ads 707,392 times.
Another important thing I’d like to mention is that this data comes from 9 different markets in North America, the UK, and Europe.
However, it’s worth noting that the US, being the largest market, makes up 26.51% of the total spending and 21.78% of the total sales.
The Data Comparisons
If we compare our 2023 PPC Performance with the 2022 Prime Day numbers, looking at July data, we see that we had an increase of 85.50% in Sales.
But of course, one can imagine, there can be other reasons in play here also, so for a more closer view, let’s look at how July fared vs June 2023.
Month over month data showed that we had a 64.91% increase in Amazon PPC sales.
And for more of a closer look, let’s look at week-over-week performance, we also call at as WoW performance.
Starting with the traffic numbers:
- Ad Impressions shot up by a massive 445.68%. In the US, this difference was even more astounding – a staggering 658.98% increase.
- Clicks on the ads went up by 316.18%. Mexico was a bit of an exception here, with only a 53.64% increase, the smallest among all nine countries. Turkey followed with a 144.39% increase. In the US, clicks increased by 363.26%.
Moving on to sales:
- Sales during Prime Day week saw a remarkable 290.36% increase compared to the previous week. Mexico played a notable role with a 311.12% increase, making it the top performer with a 250% Spend to Sales ratio. Mexico also stood out with an impressive 8.04% ACOS and a $12.43 ROAS, showcasing exceptional performance, the best among all nine countries.
Campaign-Type Breakdown
Now, let’s take a look at how our campaigns are divided.

Reviewing the average spending on our PPC ads over the past 13 months (from July 2022 to July 2023), we noticed there’s a ratio of 70:10:20.
Here’s how it breaks down:
- Sponsored Products ads accounted for around 68.32% of the total ad spending.
- Sponsored Brands made up 9.66%.
- Sponsored Display used about 22.02% of the total ad budget.
Now, let’s compare these numbers to how we spent on ads during Prime Day 2023.
We saw a 16.36% increase in spending on Sponsored Products. On the other hand, both Sponsored Brands and Sponsored Display had noticeable decreases.
When it comes to sales, the proportions stayed somewhat similar. However, the most notable change was in Sponsored Display sales, which increased by 8.52% compared to their average over the past 13 months.
Targeting Level Breakdown
Now, let’s dive a little deeper and see how the Targeting breakdown is shaping up.
In this breakdown, we’ve split the targeting into 4 main parts:
- Brand: These are all the keywords related to the advertising brands.
- Non-Brand: These are general keywords that relate to the products, not tied to any specific brand.
- PT (Product and Category Targeting): This includes targeting based on the specific products or categories.
- Audience: This involves targeting people who have shown interest before, either through remarketing or Amazon audience targeting.
Let’s take a closer look at how each of these 4 targeting sections performed.
Spend:
– Brand: 33.64%
– Non-Brand: 43.92%
– Product Targeting: 18.03%
– Audience: 4.40%
Sales:
– Brand: 51.51%
– Non-Brand: 26.75%
– PT: 17.45%
– Audience: 4.29%
Lastly, I’d like to share some important numbers that show the percentage change in PPC (Pay-Per-Click) Sales for these 4 targeting segments on Prime Day compared to the average of the previous week’s 2 days.

Here’s how the sales increased:
– Branded sales shot up by 643.61%
– Non-Branded sales surged by 1594.30%
– Product Targeting sales saw a remarkable increase of 1112.67%
– Audience targeting sales experienced an impressive growth of 1638.91%
This data gives us a clear picture of how each type of targeting performed during Prime Day in comparison to the previous week’s average sales.
How did your Amazon ads performed on Prime Day?
How did your sales look this prime day? Did you manage to get all time high sales?
We’d love to see some insights from you, let us know in the comments below.
PS. If you need help with analyzing your data to find key learnings and insightful breakdown for Q4 preparations, Contact us to schedule a free audit call.

Mariam
15 08 2023
Wow!! Well Done!!!
Sheraz
15 08 2023
Great